Development of the Cash Flow Phasing Algorithm


The Product
UniPhi (Aus) Pty Ltd develops software for the built environment. Our core web application has been used to develop innovative outcomes for organisations across the entire construction value chain including developers, consultants, contractors and sub-contractors.
One of the key target markets for our cost and contracts modules is the cost management professional. The product evolved out of this relationship with our cost management clients who came to us to advise that the marketplace does not currently have any accurate algorithms for phasing cash flows for construction projects. Among the problems faced by cost managers when attempting to produce a reliable cash flow is the disparate nature of the information they rely on (estimation tools, excel spreadsheets, emails, document versions, etc.). Once a cash flow is created, it requires further analysis to ensure data accuracy and validity, all of which takes yet more time. Up until recently UniPhi allowed an estimate to be phased in a linear manner over a period of time, or manually to fit the Gantt. While working closely with a number of our clients we realised that there was no recent software system that allows for automated 'S' curve phasing. An 'S' curve is the shape a cash flow typically takes when profiled on an XY diagram due to the fact that projects generally start slow, get busy in the middle, and tail off during practical completion.

Figure 1: 'S' curve phasing of a project's budgeted cost over time – Auto Generated by UniPhi’s benchmark algorithm
Currently, most of the industry is using a CSIRO developed algorithm that was released in the 1990s and only runs on Windows 95. Knowing our expertise in creating benchmark software, our clients presented us with a hypothesis that the actual earned value from past projects could be used to derive the earned value of future projects thereby producing a far more accurate cash flow forecast than the current method.
With the goal of improving cash flow phasing in mind, we took a step back and analysed the available data that was stored in UniPhi. The core design structure of UniPhi means that data entered once is available in many places. One example of this is the progressive sequence of payments made against a contract. This information tells us the actual dates that payments were made, and their individual values. These payments represent the earned value of the project.
Our development team realised they could use this "Actual" phasing to create an automated benchmark algorithm. The most impressive thing about the benchmark feature and its underlying algorithm is that UniPhi users are automatically generating the benchmark data via the contract admin function that they've been using for years. Leveraging this intellectual property to create an improved service to users of cost information is the result.
The applications of this algorithm are extensive with our clients required to produce cash flow forecasts for bank reports as part of funding applications proffered by property developers when applying for development loans as well as cost benefit analysis and generate portfolio cash flow forecasting.
The organisations inputting into the project that led to this feature are global cost consultants in the construction industry and they see the applicability of the algorithm to be a global one. They have searched globally for similar solutions and have not found any. Since its release in July 2016, we have engaged with four cost management consultancy firms and a public property developer who are now utilising this feature to great success. The end user accesses the software through a web application. It is sold as software as a service and organisations subscribe at a rate of AUD70 per user per month.
Features
The best way to understand the features of the software is to see it in action. A video demonstrating how a cash flow can be generated in 30 seconds is demonstrated below:
The cash flow generated is far more accurate than any other forecasting process including methods that utilise detailed bottom up work breakdown structures and complex Gantt chart linking that can take days to set up and days to maintain (see performance section below for results).
There are four components to the benchmark cash flow phasing algorithm:
The historical data engine. The system needs historical projects with the expenditure on these projects phased into the months that the money was actually spent. This represents the earned value profile of a real world project as it actually occurred. The more historical projects the better the engine as each project is training the system. This data can be broken down into components (e.g. main works, architects fees, furniture, fittings and equipment etc) or it can be just captured as one line per month for the project as a whole. Obviously the more detailed the data the more accurate the forecast.
Meta data describing both the historical projects and the current project being worked on. The number and types of Meta data that can be captured is unlimited and is defined by the end user via custom fields within the application. However, typically, it includes things like design characteristics of the project (e.g. wall to floor ratio), size and scope (e.g. number of floors, floor area etc), location and timeline. As the user creates new pieces of Meta data, the fields are dynamically added to the interface to filter on and analyse (See figure 2 below in the End User section). This is essential as it enables the end user to determine which projects match the current one and to then select these projects as the pool of historical projects that will drive the earned value calculation.
Adjustments for productivity. Globally, there are time periods where construction productivity is lower than normal. In Australia, this is over the Christmas New Year time period. The system needed to be told that this dates would have reduced output and to factor this in accordingly (see figure 6 below in the Performance section).
The algorithm itself normalises the historical data and applies it to the timeline of the new project. This algorithm is the black box magic that makes the end user able to generate a cash flow in less than 30 seconds and is proprietary to UniPhi (Aus).
Once the algorithm has done its job, there are two key output features:
A graphical representation of the cash flow over time (the typical ‘S’ curve shown in figure 1 above) and
A tabular output of the cash draw down month by month. These reports are included in bank submissions for funding to present with confidence the exact cash requirements month by month (see figure 1 above and 5 below in the End User section).
End User
One of the key challenges to any software product is being able to present the information to an end user in an intuitive way that assists them in formulating the inputs correctly and knowing how to operate the application. This project had particular challenges in this regard as there were multiple requirements with unique issues to address. The first was how to present past projects with their Meta data in a way that allowed the end user to easily select “like” projects.
The second issue was how to show the results of the phased actuals in a way that demonstrated a good result. This second issue was resolved via the resolution of a third issue which was to present the phasing of the sample pool of projects compared to how their phasing actually occurred, thereby presenting the end user with the accuracy of their selected pool. Frequent presentations were made to end users to assist in this experimentation and gain feedback on the interface design.
UniPhi’s core application allows for the capture of unlimited types of project meta data. This meta data is captured by the end user against both historical and current projects. The interface then provides an intuitive filtering and results display option that allows the end user to analyse and decide on what collection of historical projects best represents the future project they are working on. The end user then ticks the relevant projects they wish to use.

Figure 2: Historical projects listed with timelines, actual value and meta data values like No of Floors, Floor Area etc
There is also a range of options to manage the timeline of the phasing. This assists the cost manager update the cash flow if time elapses and decisions are not made. For example, linking the main works contract to the construction dates of the project allows for the cash flow to automatically update if these construction dates are amended.

Figure 3: Lifecycle dates that can link to cash flow phasing for easy updating

Figure 4: Construction phase from lifecycle phasing automatically select the start and end date of the cash flow
The benefits of the benchmark algorithm feature for forecasting cash flow is extensive and includes the ability of the end user to utilise their own IP in generating the cash flow estimate and thereby differentiate themselves to their clients. For example, a client that has historical information regarding apartments will have the underlying data to train our algorithm to produce an accurate forecast while another client may have historical information regarding hospitals. Both use the same software but can sell their difference in the particular sector they specialise in.
This feature is of huge importance to property developers when evaluating the viability of a development and when seeking finance from a funder. Knowing that the forecast cash flow of the project will be accurate means that they can potentially reduce the total draw down facilities required and know exactly when these funds are going to need to be available.

Figure 5: Tabular output of budget cash flow generated by benchmark algorithm
R&D
As no phasing algorithm existed in the market place that used the earned value of past projects to forecast future ones, there was no way of knowing whether this method would provide a more accurate way of phasing budget estimates or not.
Only by experimenting with real data from past projects could we ascertain whether this vital service for the construction and property industry was going to be able to be provided. The accuracy of the project's hypothesis was a complete unknown.
To generate the algorithm, we had to experiment with the best mathematical formula to normalise cash flows from past projects of differing durations into a common % complete for a time period and date range provided by an end user for a new project. Several mathematical formulas were developed to determine the correct % complete including whether the actual values needed to be split into day values or if month values would be accurate enough (they weren't).
To test the idea, actual information provided by our clients of past projects had to be imported into the UniPhi system. Once this was done, the algorithm that normalises the different time periods of the completed projects to the time period of the new project was created. Added to this, productivity adjustments functionality added to allow for industry wide down time (for example the shut down over Christmas in Australia and the shut down over Chinese new year in Asia).
Experiments were conducted to test the variation between different actual phased data sets to see whether specific functional units made an impact or not. This was carried out for 10 different sectors and over 10,000 combinations of functional units. This testing lead to the conclusions outlined below in the performance section that stadiums, transport and infrastructure do not generate good lessons for future cash flow forecasts.
An interface needed to be developed to allow for the choosing of "like" projects as a stadium construction will be significantly different to an apartment building and within these "sector" types, the number of basements and other functional units could also drive the earned value. This interface was prototyped and presented to clients for feedback with iterations developed over 6 months until the end result was agreed upon by the sample group.
UniPhi already had cash flow outputs and these outputs were sufficient for the needs of the end user.
Performance
We completed a preliminary implementation of the "S" curve functionality to one of our clients, and found that when compared with their old process of manual calculations, UniPhi's cash flow phasing and associated "S" curve were produced to great satisfaction, and accuracy. Not to mention being much faster than the old method. Through this process of collaboration and review, we discovered that there were additional levels of nuance that were observed and could also be leveraged. Therefore we added a productivity column. The purpose of the productivity column is to factor in periods of low productivity, e.g. Christmas, New Year, and public holidays. The concept of factoring in these periods of lower productivity is powerful, but our design makes the configuration very simple to configure and update.
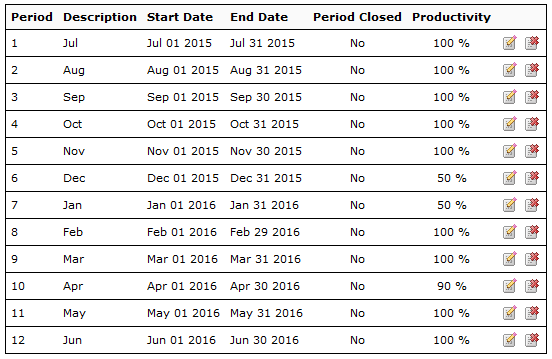
Figure 6: Productivity adjustments to the way a budget is phased over time
The algorithm was applied to past projects to compare to the actual phasing that occurred to test the accuracy of the calculation. After many iterations of tests, it was discovered that for 7 out of 10 sectors (with transport, infrastructure and sports and leisure being incompatible), the methodology of using past projects to generate the phasing algorithm of new projects was accurate on a month by month basis to plus or minus 5%. This result gave significant comfort to the cost consultants over their current method that could not be applied to as many sectors and rarely gave as accurate a result.
The time taken to generate a cash flow forecast is now down to 30 seconds whereas the various methods used in the past were either far less accurate for this amount of time spent or were laboriously generated from bottom up work breakdown structures that can take days to produce and days more to maintain.


